
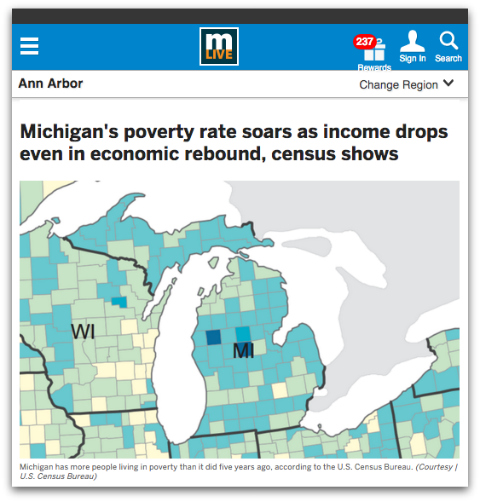
There was a feature on MLive today about the newly released census data and what it tells us about the trajectory of Michigan’s economy. After stating, “median income in three out of every four Michigan cities and villages (had) declined in the past five years,” and that “the share of people living in poverty has risen in two-thirds of the state’s communities,” the author of the piece, reporter Matt Vande Bunte, shared the following: “Statewide, more than one out of every six people are living in poverty, a 17 percent increase from the previous 5-year period.”
My first inclination was to take to the internet and lash out at our governor, Rick Snyder. But, as I sat here, thinking about how to best go about skewering him on Facebook, it occurred to me that something just didn’t sound right about it. So, as I often do, I reached out to my census-loving friend Richard Murphy and asked if it was true that our poverty rate had risen 17% over the past five years. And, as it turns out, I was right to have been suspicious.
According to Murphy, who has since taken to his own website to explain what’s really going on, the article fell short on a number of fronts. Perhaps most notably, they chose to compare five-year periods, instead of looking at the change from year to hear. Here’s an excerpt from Murphy’s analysis, which you really should read for yourselves. [Just follow that last link.]
…Any place the numbers “2014” and “2009” are used in these reports, they’re wrong. The new Census data is the 5-Year American Community Survey data for the period 2010-2014. These numbers are the result of surveys given over a 5-year period and rolled up (with some weightings) to create a statistically representative sample.
The Census Bureau’s pre-release webinar for media users explicitly states that the data “describe the average characteristics over a specific period of time, not a single point in time”. (The webinar also states the 5-year data should be used when “No 1-year estimate is available”. More on that in a minute.)
So what the data actually show is that, during the period 2010-2014, Michigan’s poverty rate was 16.9%, 2.4 percentage points higher than Michigan’s poverty rate of 14.5% during the period 2005-2009.Those are big blocks of time. In 2005, the housing boom was in turbo-mode and would be for sometime longer–and that’s averaged in with the 2009 depths of the recession. Similarly, the “new” data covers a period from 2010–still on the economic rocks–to 2014. This is not the right data to use to describe changes “in the past five years”, because that entire 5 year period is lumped together as a single data point.
So… do we know anything at all about poverty trends?
Sure. Actually, much more useful data for this was released back in September, when the 1-year ACS numbers came out. While the 5-year ACS data covers areas down to the “block group” scale (around 1,000 people, as a rule of thumb), the 1-year data only covers areas of at least 60,000 people, in order to have statistically meaningful sample sizes. Fortunately, Michigan’s population is over 60,000 people, despite what decades of national press might lead one to believe.
Looking at the 1-year ACS numbers, Michigan’s poverty rate over time looks like this:
2005 – 13.2%
2006 – 13.5%
2007 – 14%
2008 – 14.4%
2009 – 16.2%
2010 – 16.8%
2011 – 17.5%
2012 – 17.4%
2013 – 17%
2014 – 16.2%From these one-year numbers, you can see that Michigan’s poverty rate in 2014 was the same as in 2009, at 16.2%, and that the poverty rate peaked in 2011, dropping every year since. These numbers also clearly show why the five-year bundle of 2005-2009 is a bad data point to use for “the recession”, and 2010-2014 a bad data point for “the recovery”…
So, no, there wasn’t really “a 17 percent increase (in poverty) from the previous 5-year period,” as was reported. In fact, the rate, as you can see above, has actually been dropping. So, if you, like me, want to hate Rick Snyder for something, you’ll have to look for something else… This, of course, isn’t to say that a 16.2% is acceptable, or that the people of Michigan aren’t suffering as a result of the policies coming out of Lansing. We clearly are. I just think it’s important that we all know the real facts… I should also add that, in spite of the fact that our statewide average is 16.2%, that doesn’t mean the rate isn’t much higher in cities like Ypsilanti, where close to one-in-three live in poverty.


14 Comments
And that’s one more thing. They made it sound like it was a jump of 17 percentage points, like we had 17% in poverty 5 years ago, and we have 34% now. What they meant was that the number had increased by 17%, like from 17% to 19.9%… Misleading all the way around this article was. [Yoda speak.]
And they really should take the article down. You can’t say that the numbers are soaring in they’re dropping.
I appreciate your integrity, Mark, which is not a small thing, but I would like more from a post discussing this information.
Are other states experiencing dropping poverty rates? Are they dropping faster, slower, or at the same rate?
How much legislation aimed at poverty has been taken up in the Michigan legislature over this period? What policies have any branch of government enacted that had an effect on this rate?
Or, if you want to get a little philosophical, why are we all so prepared to believe that poverty in this state is skyrocketing? If you haven’t guessed, I think that what’s going on here is one of the “and we all know it” situations that are now the hallmark of midwest GOP-run states whose officials make little effort to hide their rape of the common man, and whose common men for the most part lap it up like thirsty kittens at a puddle of dirty milk.
Funny, my seat of the pants feeling is that the recovery is well on its way. My company is having a heck of a time filling positions this year, something that was not a problem several years ago. Some of the open positions are because of retirements, but many are because people are leaving for other jobs, an opportunity that did not exist a while back. My take is that it depends on who your friends and neighbors are, and what they do for a living. I’m certainly seem seeing more shiny new cars in the parking lot.
But … these numbers still show that the “official” poverty rate is 3 points higher than the initial period … so nearly a DECADE later, the trend is still going in the wrong direction.
I would also like to know if/how changes in how “poverty” is measured occurred over that timeframe. I think it would also be relevant to compare these numbers against how many people/families dropped out of “poverty” (often ever-so-slightly) because they became eligible for TANF, Obamacare, etc., rather than becoming legitimately better off.
My sense is that, for many people living in Ann Arbor or other bubble communities, things seem to be getting much better … but a quick drive to Jackson, Flint, or Monroe, etc., would demonstrate that more people than ever are struggling. Add in the the explosion of high-interest “payday” loan outfits and “rent-to-own” furniture/appliance shops, and the snowballing student loan crisis, and many people have simply given up on the opportunity to achieve anything approaching a “middle class” lifestyle.
In short, my personal experience makes me distrust these kinds of numbers … much the way “official” numbers show the unemployment rate dropping steadily, even though that figure doesn’t take into account the rising numbers of people who have retired, become “disabled,” been forced to accept seasonal, part-time, or low-wage employment, or simply dropped out of the labor force entirely – often couch-surfing with friends or family.
The poverty rate is still above 15% (which is shameful in my opinion) and we should stop patting ourselves on the back, especially in the Washtenaw County bubble. When these sorts of numbers are said to be improving nationally, critics are quick to point out, as Demetrius does above, that many people are excluded from the stistical computation for various reasons. The same is true in Michigan.
My intention in posting this wasn’t to say, “There’s no problem in Michigan.” There is…. It just pisses me off that I almost shared the MLive article at face value, demanding the we start recall procedures against Snyder. It’s unconscionable, I think, for them to print sometime about he statewide poverty rate “soaring” when it’s, in fact, dropping. And I’m mad at myself for coming within a minute of sharing it. Again, this isn’t to say Snyder is doing a good job with he economy. Wages are dropping across the state as a result of right-to-work and other right wing initiatives. I just don’t think we need to have the right fight, based on good data.
All the further questions mentioned are good ones — and they’re the reason that bad data reporting irritates me so much: the misleading clickbait obscures our ability to have those conversations, rather than supporting them. So posts like mine, and this one, have to dig out from underneath the misunderstanding just to get to the baseline point that we can start having those discussions.
Did MLive edit their story based on these posts?
As of right now, the MLive article has 1,048 comments, so it’s a success in their eyes.
To paraphrase Mark Twain: there are lies, there are damn lies, then there is statistics.
EOS is going to chime in about the world being 4,000 years old.
Sort of related, but not (to poverty, that is)… Jcp2 mentioned a seat-of-the-pants feeling that recovery was happening, and part of that evidenced by difficulty in filling positions. I agree that recovery is happening, but slowly (almost glacially) but is really happening. “Recovery” has many faces, but to the point Jcp2 mentions about hiring – and my perspective comes from the engineering and manufacturing side of things:
— After… oh, say, 2011, big manufacturers started making capital investments again on 3-5 year timelines, seeing that things were improving and they needed to be ready to have new stuff to sell . Making cars and whatnot is a 5 year process – from product design, to suppliers, to equipment design, to manufacturing execution. On the B2B side, it’s been happening for a good long while. Slow and cautious, but clearly a recovery.
– There’s been a huge brain drain in MI from the 2008 crisis. It’s REALLY hard to find even halfway decent people these days (ask any technical recruiter). The people who still have jobs and are content are staying put and not taking any risks (so can’t be convinced away), the people that lost jobs and couldn’t find them in 2010 have left the state and aren’t coming back, and out-of-state candidates can’t be convinced to move to MI (“why would I do that? you saw what happened in 2008. you gotta be crazy to move to MI.”)
Oh, and @Murph: thank you for using a fixed-width font in your table of 1-year ACS data. Seriously. It’s incredibly soothing on the eyes for the columns to line up.
One Trackback
[…] 2, 12:30pm 12/5/15: lots of traffic to this post–welcome! You should also check out the comment thread on MarkMaynard.com’s discussion of this post; his readers offer a lot of good thoughts on what good reporting of these data *could* look like, […]